Magnetometry
Background
Magnetic field changes in volcanic systems
The Earth's magnetic field arises as a result of the motion of enormous volumes of molten iron and nickel thousands of kilometres beneath the surface, in the outer core. Besides protecting the Earth and its inhabitants from the potentially harmful solar wind and other cosmic radiation, it has been fundamental for navigation over the centuries. The field can be roughly approximated as a dipole (like that of a simple bar magnet), but it is not entirely static and unchanging. Over geologic time (hundreds of thousands, if not not millions of years) the Earth's magnetic field changes due to variations in the internal dynamo. These variations, known as secular variations, have left their mark in the geologic record in a number of ways. Take, for example, the crust in oceanic basins. They appear outwardly rather uniform, roughly symmetric around central rift zones. When viewed, however, in terms the magnetisation of the crust, periodic stripes of alternate orientation are revealed. The discovery of these "magnetic barcodes" provided a fundamental piece of evidence in support of the theory of plate tectonics.
But the Earth's magnetic field can also vary on much shorter timescales. On one hand, there are external forcing effects such as changes in solar wind strength (related to magnetic field snapping in the Sun) that affect the magnetosphere. Large geomagnetic storms give rise to the polar auroras. On the other hand, changes in the volumes of material that can sustain an intrinsic magnetic field and/or respond to variations in the Earth's extrinsic field can also create local changes to the magnetic field.
Above a certain temperature, known as the Curie temperature, rocks in the Earth's crust can no longer sustain permanent magnetic properties. Volcanoes are the manifestation of heat escaping from the Earth's interior over concentrated geographic regions. Consequently, the presence of large volumes of molten or partially molten material above the Curie temperature in volcanic environments leads to changes in the local magnetic field. By measuring the evolution through time of the local magnetic field, we hope to better understand the migration of melt materials in the subsurface in the build up to, during, and after a volcanic eruption.
Measuring the Earth's magnetic field
We measure the Earth's magnetic field using instruments called magnetometers. There are two categories of magnetic field measurements:
- Scalar measurements record the total intensity of the field—or simply how strong the magnetic field is—but lack any information about its orientation.
- Vector measurements record both the total intensity of the field and its orientation. This orientation is often expressed in terms of a declination and an inclination angle.
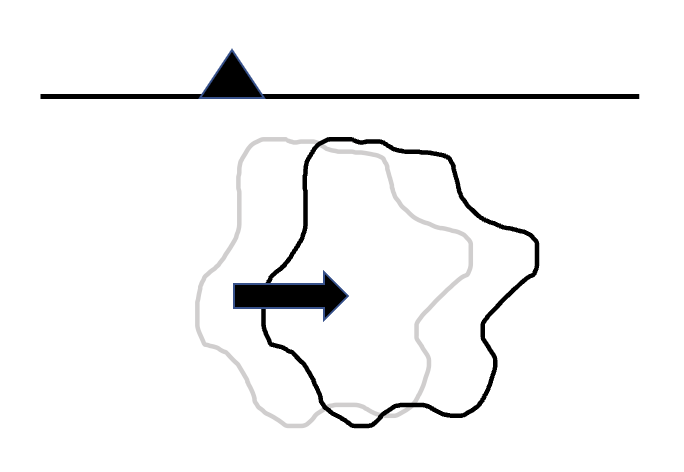
Fluxgate magnetometers are a common type of magnetometer used to make vector measurements of a magnetic field. They consist of a small magnetically susceptible core wrapped by two coils of wire. An AC electric current is passed through one coil, driving the core through an alternating cycle of magnetic saturation. This constantly changing field induces an electric current in the second coil, and this output current is measured by a detector. In the absence of an external field, the input and output currents will match. However, in the presence of a non-zero external field, the core is more easily saturated in alignment with that field. A schematic diagram of such an instrument is shown below.

A two-core fluxgate magnetometer (Vacquier design), reproduced from Turner, Rasson, and Reeves (2015).
Magnetic field data
Our instruments
We are using Mag-13 three-axis fluxgate magnetometers manufactured by Bartington Instruments. For more information, please see the Bartington Instruments webpage. The voltage signals output by the sensing coils in this instrument are digitised using the 24-bit Nanometrics Centaur datalogger, which we also use to digitise the signals from our analogue seismometers.
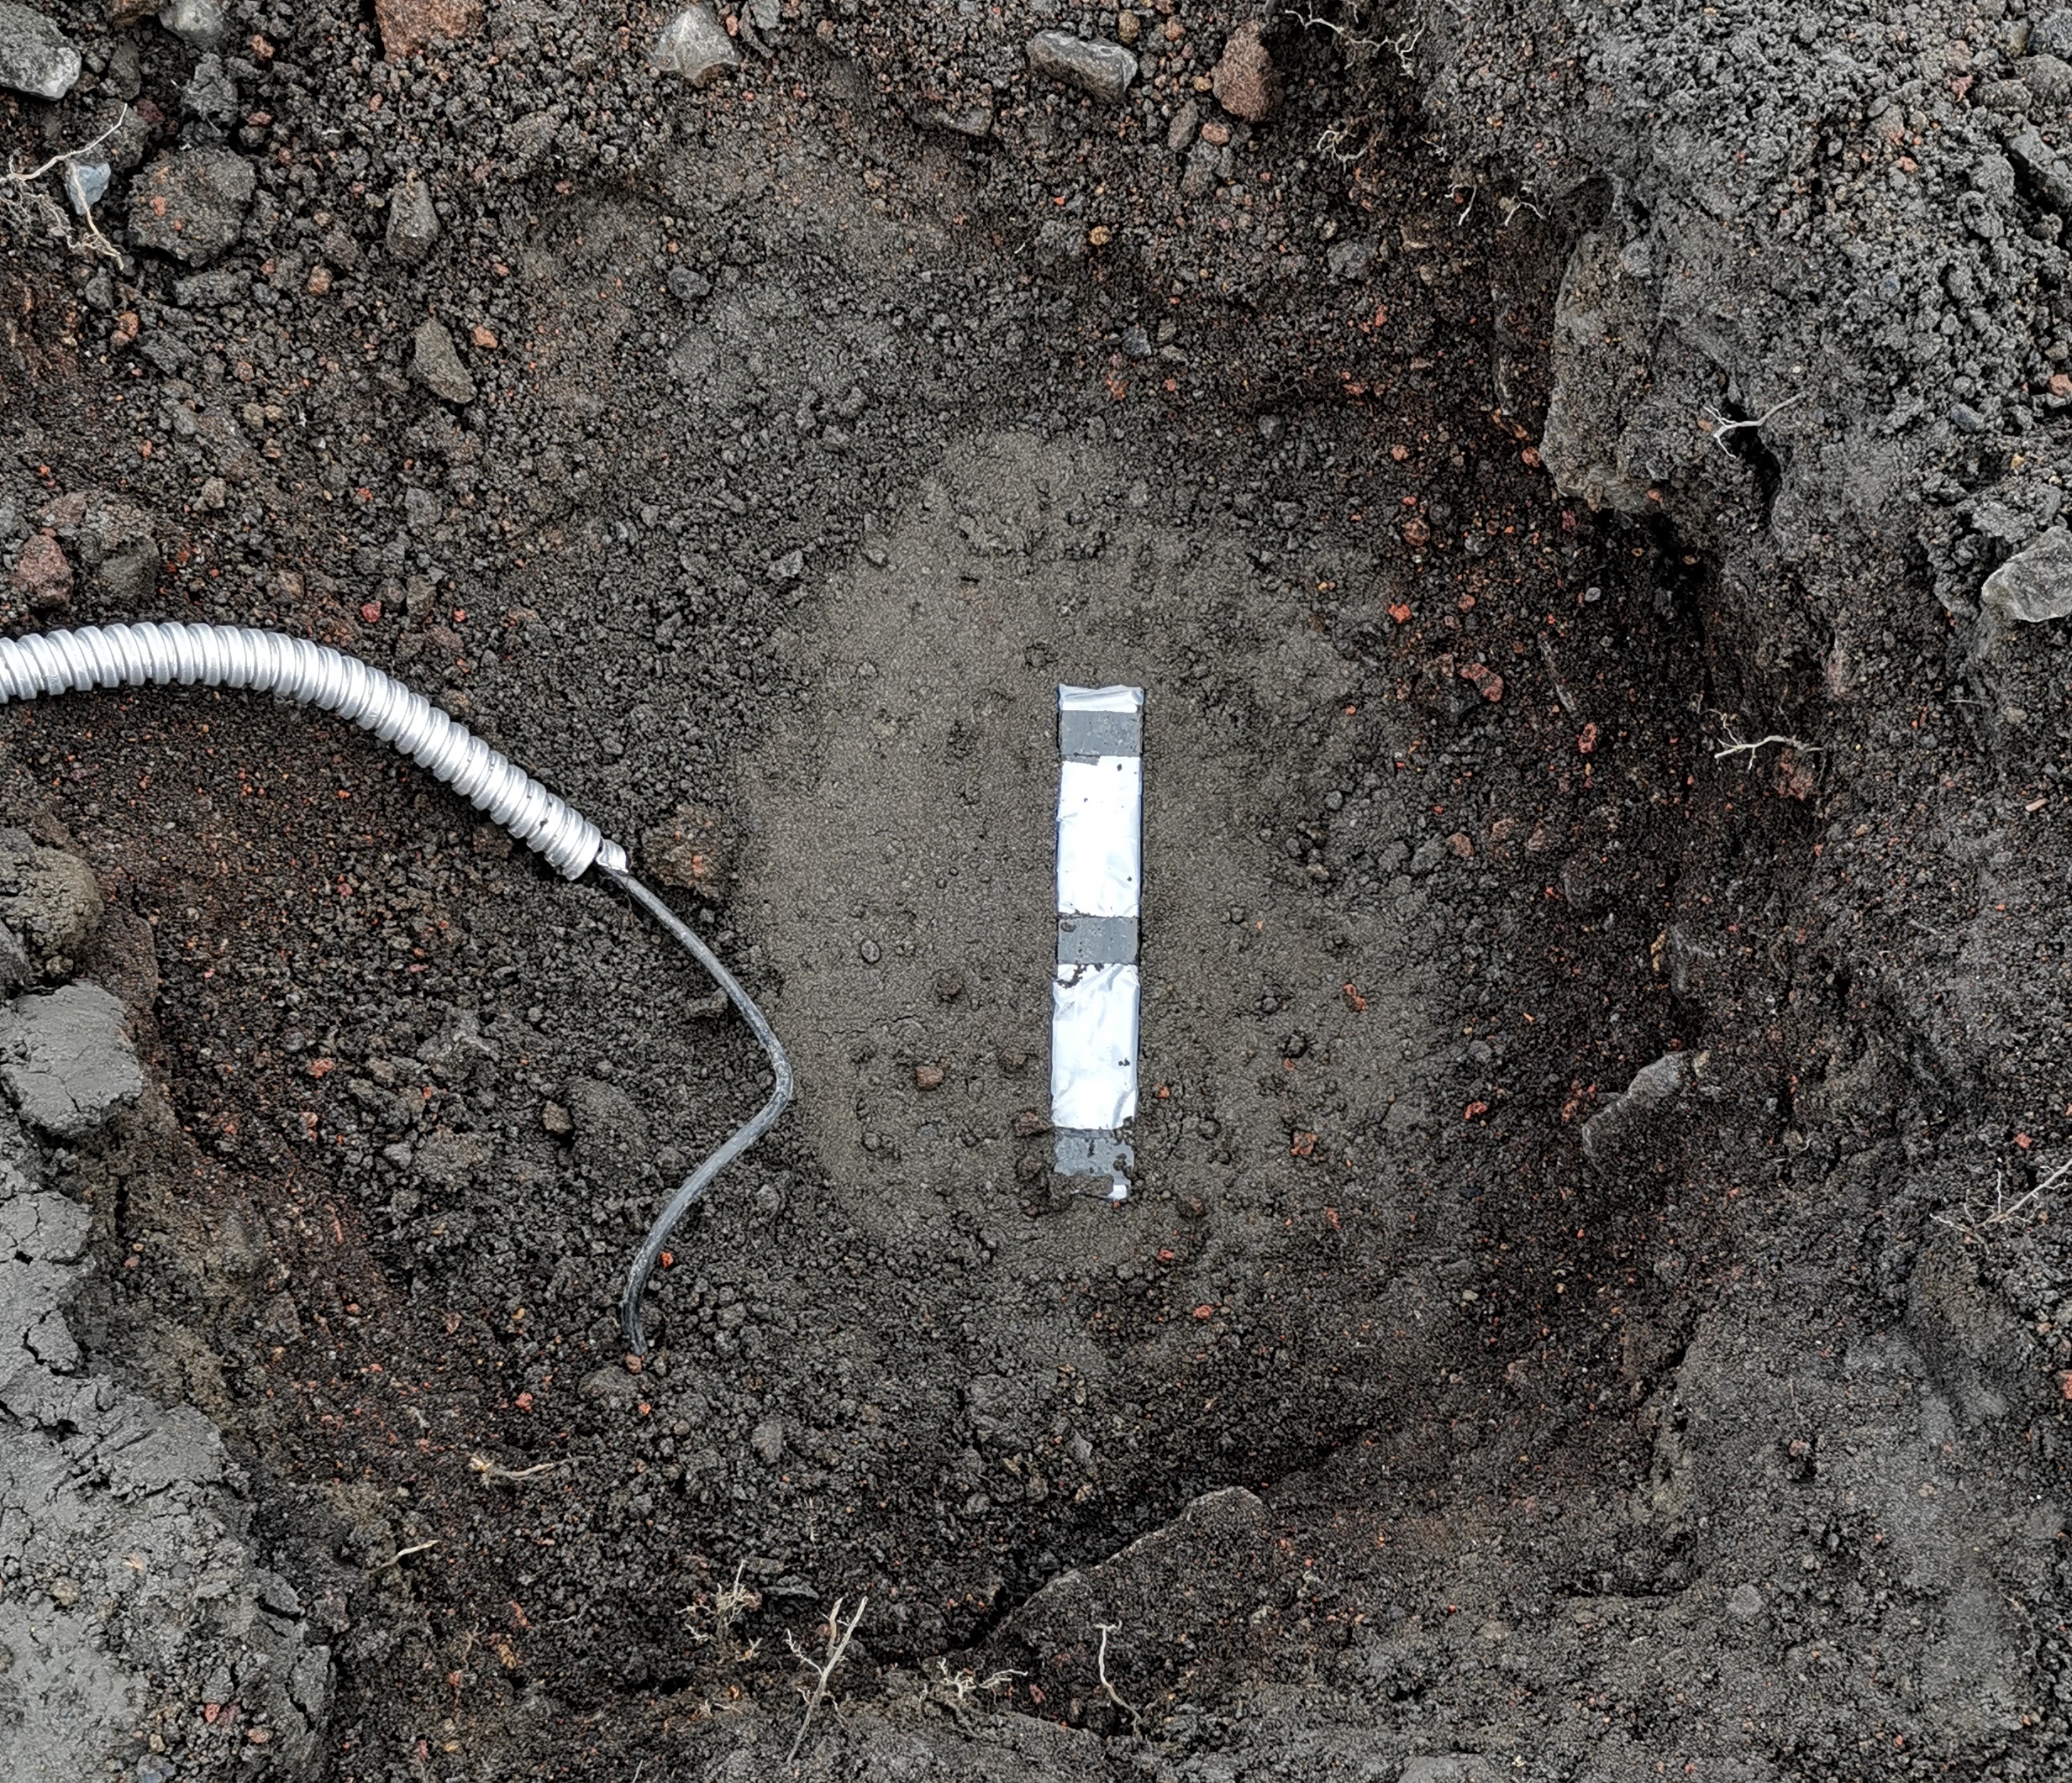
A top-down picture of one of our fluxgate magnetometers in the ground at Okmok volcano, in the Aleutians. This device, approximately 25 cm in length, contains 3 orthogonal fluxgate magnetometers that continuously measure the orientation and magnitude of the local magnetic field.
Example data plots
Some sample data from the AV.OKBR magnetometer, deployed inside the Okmok caldera, are shown below.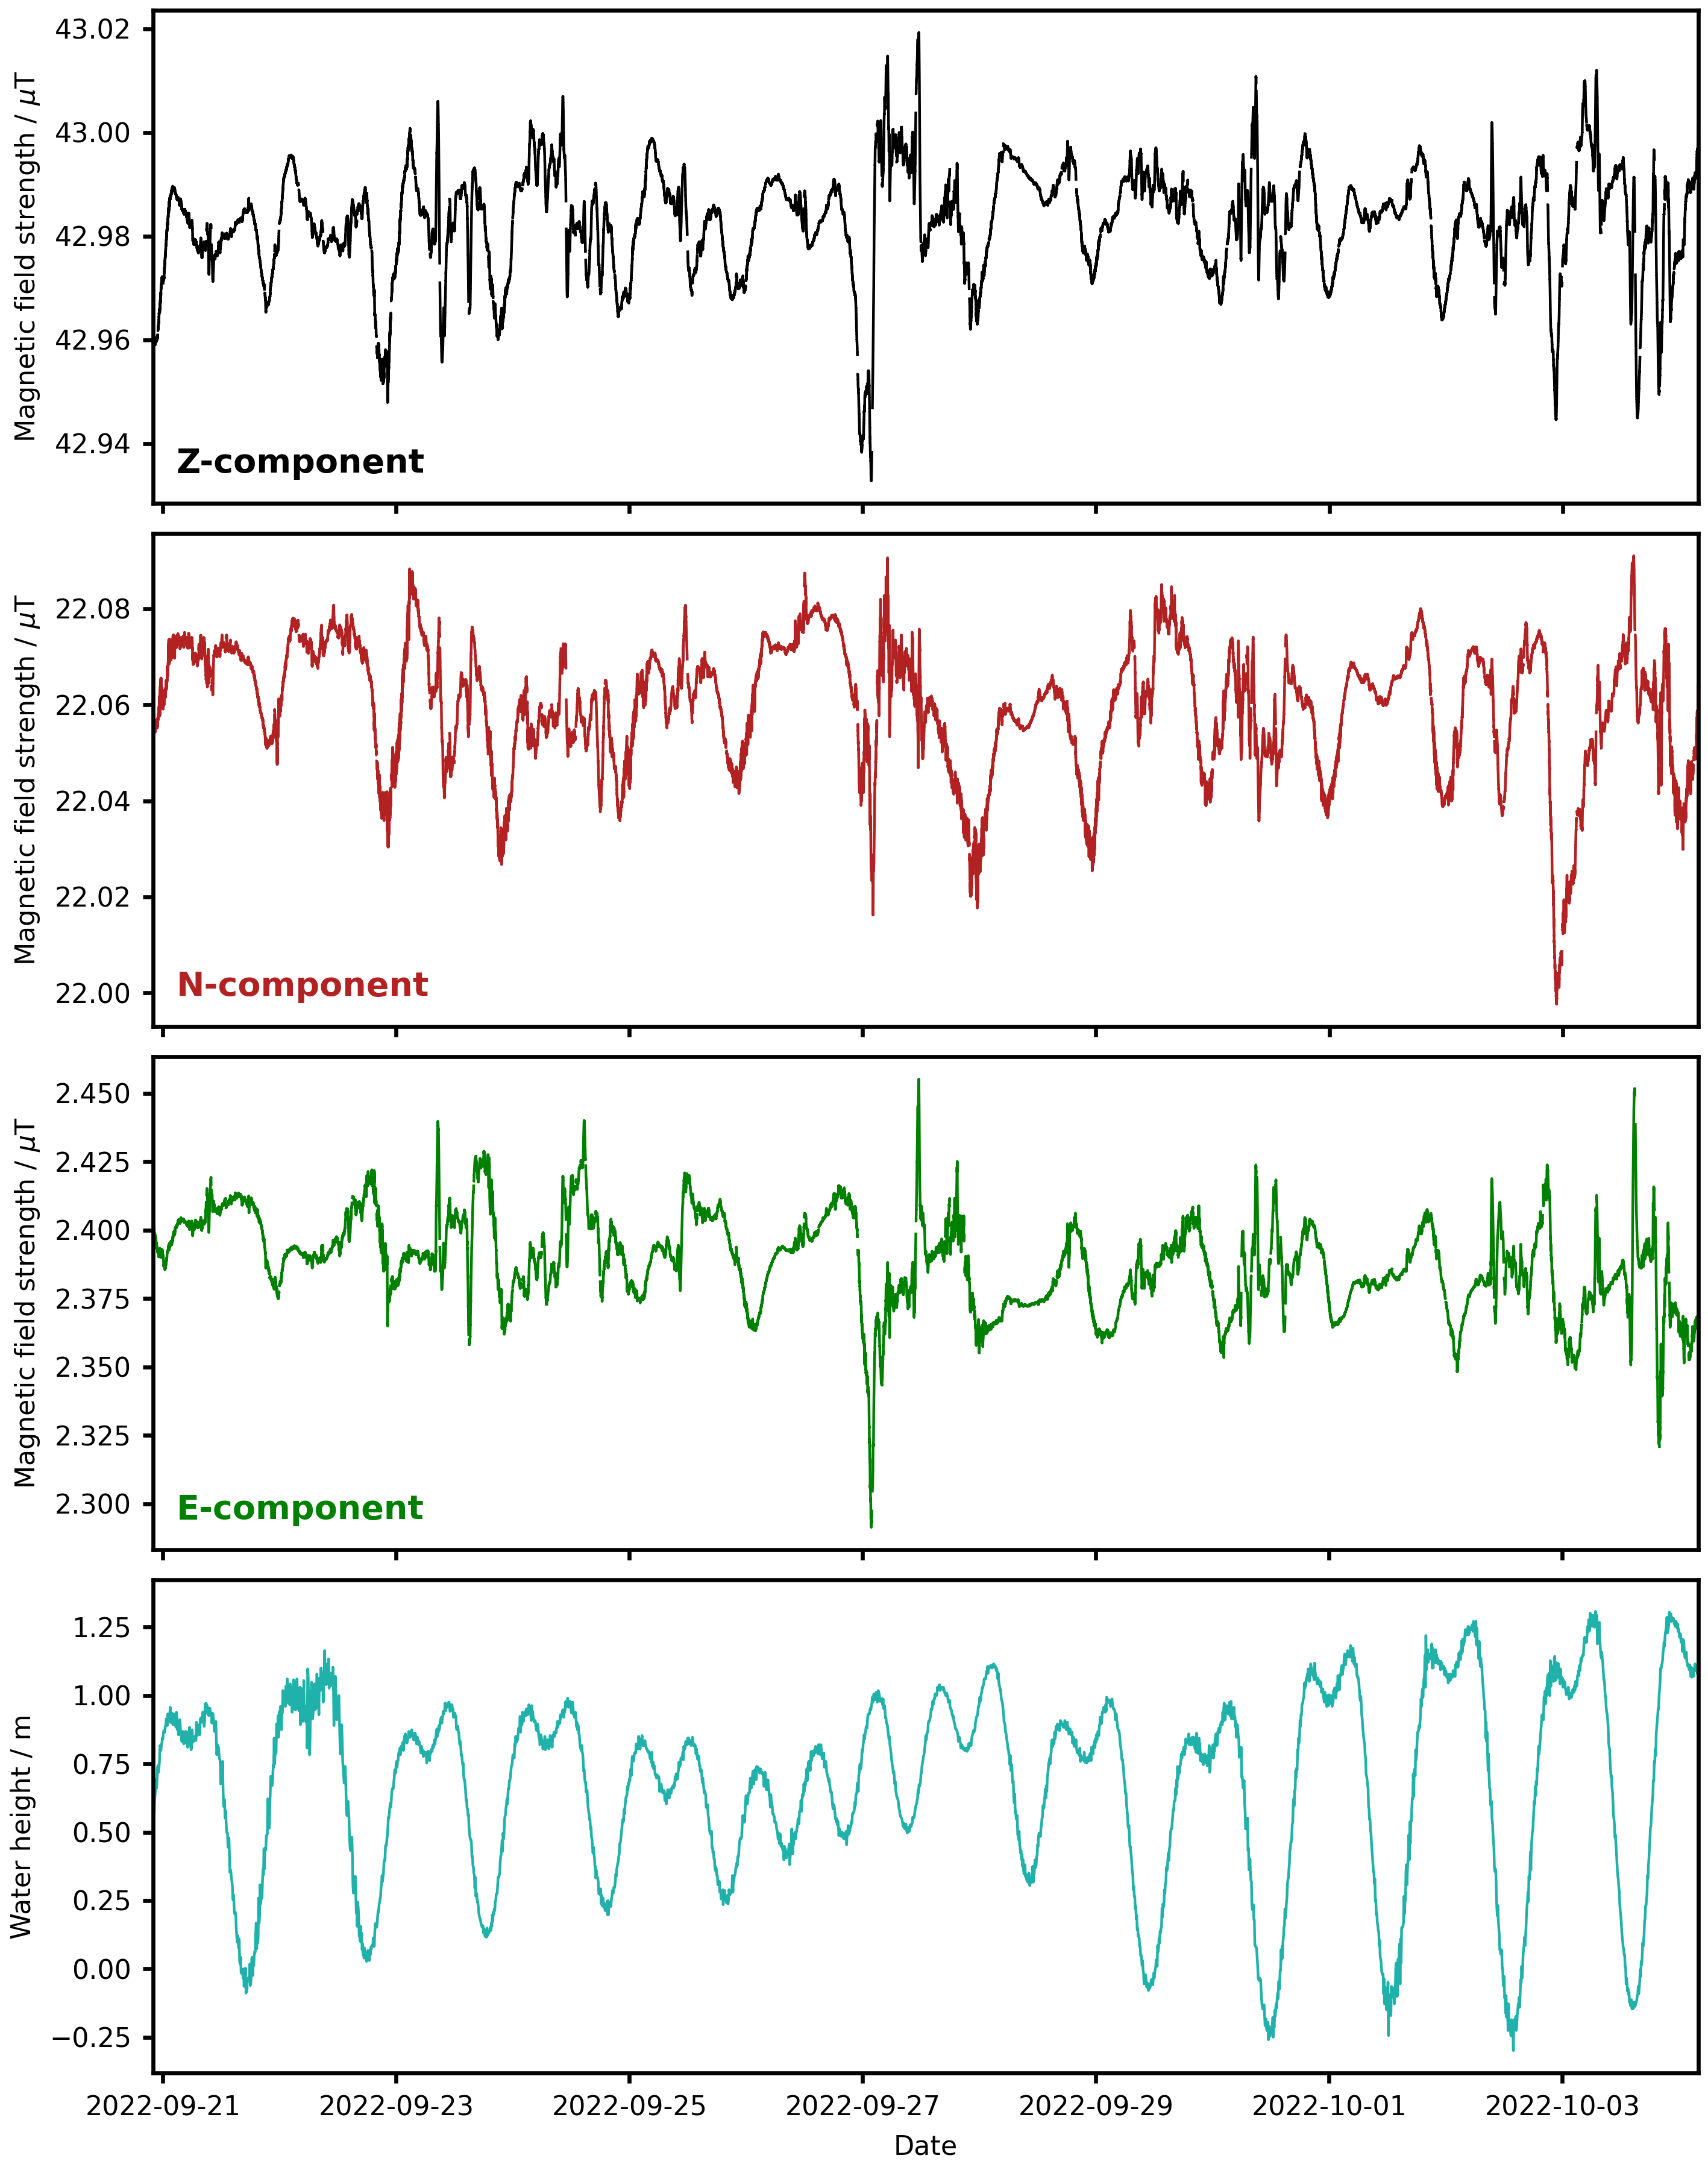
An example snapshot of the vertical component of the magnetic field, recorded at the station OKBR, on Okmok. The data show variations on a period of approximately a day, as well as short-term variations likely related to changes in activity in the ionosphere/magnetosphere and, hopefully, the signals we are interested in!
Data access
Weekly and monthly views of the magnetic field data recorded at each of our stations can be viewed on the respective site pages, listed below. A limited amount of magnetic field data can also be viewed interactively via our data API.
Data recorded by our 3-component fluxgate magnetometers are archived with the IRIS Data Management Center (now under EarthScope Consortium) and can be requested via the FDSN web services API. Note: in order to reconstitute the recorded data from digitised counts to physically meaningful units, you will also need to request the response files (also available via the IRIS DMC) and remove the response from the data. ObsPy provides a suite of tools for data downloading, response removal, and general manipulation of the resulting magnetic field data.
    from obspy import Inventory, UTCDateTime
    from obspy.clients.fdsn import Client


    client = Client("IRIS")

    # Get the instrument response inventory for a single station
    inventory = Inventory()
    inventory += client.get_stations(
        network="AV",
        station="CLNE",
        starttime=UTCDateTime("2022-09-21"),
        endtime=UTCDateTime.utcnow(),
        level="response",
    )
    inventory.write("CLNE_mag_response.xml", format="STATIONXML")

    # Get a day of waveform data from the data center
    stream = client.get_waveforms(
        network="AV",
        station="CLNE",
        location="*",
        channel="LF*",  # The 'F' here denotes a magnetometer
        starttime=UTCDateTime("2022-09-21"),
        endtime=UTCDateTime("2022-09-22"),
    )
    stream.merge(method=-1)

    # Write each component to a separate miniSEED file
    for component in "ENZ":
        component_stream = stream.select(component=component)
        component_stream.write(f"AV.CLNE_{component}.m", format="MSEED")
Data attribution
The instruments deployed as part of the Alaska project are archived at the EarthScope Data Management Center under the AV network (DOI: 10.7914/SN/AV), which covers the Alaska Volcano Observatory instrument network.
The instruments deployed as part of the Costa Rica project are archived at the EarthScope Data Management Center under the OV network (DOI: 10.7914/SN/OV), which covers the OVSICORI instrument network.
References
Primdahl, F. (1979). The fluxgate magnetometer. Journal of Physics E: Scientific Instruments, 12(4), 241.